How to Calculate Solar Panel Efficiency and Output

Last Updated: October 25, 2026
Quick Summary
Solar panel efficiency is the share of sunlight hitting a panel that becomes usable electricity, calculated as power output divided by sunlight energy hitting the panel, times 100. A 20% efficient panel converts one-fifth of incoming solar energy into power, though lab ratings rarely match real-world roof conditions.
- Efficiency equals power output divided by irradiance times panel area, multiplied by 100.
- Most available panels reach about 20% efficiency, while experimental modules approach 50%.
- Higher efficiency means more watts per square foot of roof, not automatically more kilowatt-hours.
- Panels lose roughly 1.04% of generation capability annually from material degradation.
- A typical silicon module's temperature coefficient runs around -0.30% to -0.40% per degree Celsius.
Table of Contents
- What Solar Panel Efficiency Actually Tells You
- How to Do a Solar Panel Efficiency Calculation
- Solar Panel Output: Why Nameplate Watts Are Not Bill Savings
- What Moves the Numbers: Heat, Shade, and Panel Type
- Solar Panel Temperature Coefficient Explained
- Solar Panel Efficiency vs Cost: The Trade-Off That Decides Your Payback
- Get Your Roof Modeled Before You Compare Quotes
- Frequently Asked Questions
What Solar Panel Efficiency Actually Tells You
Solar panel efficiency is the share of sunlight hitting a panel that becomes usable electricity. A 20% efficient panel converts one-fifth of incoming solar energy into power; the rest becomes heat.
That number drives how much roof space you need, but not what you will save.
Here is the part most guides skip. The University of Michigan Center for Sustainable Systems reports that most available panels reach about 20% efficiency, while experimental modules approach 50% (Center for Sustainable Systems solar fact sheet).
At Go Solar DMV, efficiency is one input among several, roof shape, shade, and net metering rules matter just as much.
Standard Test Conditions vs. Real-World Performance
Lab ratings assume 1,000 W/m² of sunlight, a 25°C cell temperature, and a standard air mass, conditions your roof rarely matches.
On a hot afternoon, panel cells can run far above 25°C. Output drops as temperature climbs, which is why a 400-watt panel often produces less than 400 watts in July. A University of California Press study found that dust measurably reduces photovoltaic panel efficiency (UC Press Clean Energy dust study).
How to Do a Solar Panel Efficiency Calculation
Efficiency equals power output divided by the sunlight energy hitting the panel, times 100.
Efficiency (%) = (Power output in watts ÷ (Irradiance in W/m² × Panel area in m²)) × 100
A Worked Example You Can Copy
Take a 400-watt panel measuring 1.75 m², under 1,000 W/m² of sunlight.
- Input energy: 1,000 W/m² × 1.75 m² = 1,750 watts
- Power output: 400 watts
- Efficiency: (400 ÷ 1,750) × 100 = 22.9%
Now swap in real-world conditions. At 800 W/m² on a warm day, that same panel might output 340 watts.
- Input energy: 800 × 1.75 = 1,400 watts
- Efficiency: (340 ÷ 1,400) × 100 = 24.3%
Notice the efficiency percentage barely moved. Output fell, but so did the sunlight.
If you would rather skip the math, run your own numbers and see what a modeled system produces for your address.
Solar Panel Output: Why Nameplate Watts Are Not Bill Savings
Nameplate wattage is rated peak power under standard test conditions, not daily production. A 400-watt panel hits that only for a few hours around solar noon, and nothing at night.
Three numbers get used interchangeably in solar shopping, so keep them separate:
- Module efficiency: the share of sunlight converted to electricity under lab conditions, expressed as a percentage.
- System yield: the actual kilowatt-hours your array produces over a year, shaped by sun hours, tilt, shade, temperature, and system losses.
- Bill savings: the dollar value of that production under your utility's rate structure and net metering rules.
Higher module efficiency means more watts per square foot of roof, not automatically more kilowatt-hours, which depend on roof area, layout, and sun exposure.
Efficiency vs. Yield: A Worked Comparison
Suppose you have 400 square feet of usable south-facing roof. Two panel options:
- Option A: 22% efficient, 400-watt panels, each about 1.75 m² (about 18.8 sq ft).
- Option B: 19% efficient, 350-watt panels, each about 1.75 m² (about 18.8 sq ft).
On 400 square feet, you can fit roughly 21 panels either way (400 ÷ 18.8 ≈ 21).
- Option A nameplate: 21 × 400 = 8,400 watts
- Option B nameplate: 21 × 350 = 7,350 watts
Option A wins on nameplate capacity: each panel does more work per square foot.
Now change the constraint. With 600 square feet of roof and a 7 kW need, Option B hits 7 kW with 20 panels (7,000 ÷ 350 = 20); Option A needs 18 (7,000 ÷ 400 = 17.5, round up).
The core insight: efficiency buys you watts per square foot, not kilowatt-hours per dollar. Kilowatt-hours come from system size, sun, and losses.
Where the Kilowatt-Hours Actually Come From
A well-sited array typically produces roughly 1,200 to 1,600 kWh per installed kilowatt per year, about 10,000 kWh annually for a 7 kW system in a strong-sun region, 8,000 in a weaker one. Planning ranges, not guarantees.
Inverter conversion, wiring, soiling, mismatch, and temperature typically cost 10% to 20% of raw DC production before it reaches your meter.
Bill Savings Depend on Rate Structure, Not Efficiency
Even identical production can produce different savings depending on how your utility credits it:
- Net energy metering at the retail rate: exported kilowatt-hours offset imported kilowatt-hours roughly one for one, so savings track production closely.
- Lower export credits or avoided-cost rates: exported power is worth less than power you use on site, so self-consumption matters more than raw production.
- Time-of-use rates: production in the late afternoon or evening can be worth more per kilowatt-hour than midday production, which changes the value of west-facing arrays.
A 22% and a 19% panel on the same roof, at the same system size and rate structure, produce nearly the same bill savings. The difference shows up in panel count and roof area, not the savings line.
Measuring an Installed System
Once the system runs, verify performance against the model with three checks: inverter data, utility meter, and a clean-panel baseline.
- Inverter app or monitoring portal: shows daily, monthly, and lifetime kWh produced, and often per-panel data if you have optimizers or microinverters.
- Utility meter: confirms what was exported versus consumed, which is what the bill actually reflects.
- Baseline comparison: log output before and after cleaning to estimate soiling losses, and compare the same month year over year to spot degradation or new shade.
A few percent gap versus the model is normal, especially in shoulder seasons.
If you want to see how efficiency, system size, and rate structure interact for your address, run your own numbers and compare modeled production against your actual usage.
What Moves the Numbers: Heat, Shade, and Panel Type
Heat is the silent thief. Panels lose output as cell temperature rises above 25°C, and rooftop arrays run hot.
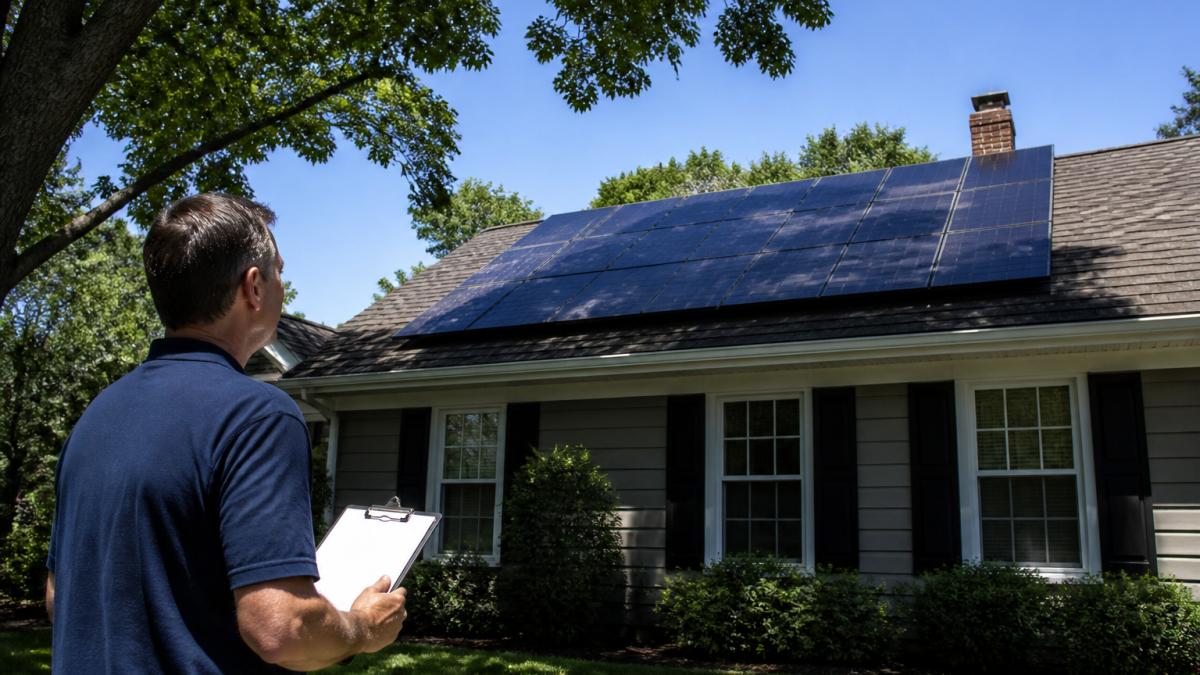
Shade is worse than most homeowners expect, one shaded cell can drag down a whole string, which is why afternoon tree cover matters. If your roof gets partial shade, read our guide on whether a shaded roof still works for solar.
Panel type matters too: monocrystalline panels generally deliver higher efficiency per square foot than polycrystalline or thin-film, which matters most when roof space is tight.
Orientation rounds out the list. Our breakdown of west-facing roof solar performance covers what to expect.
Solar Panel Temperature Coefficient Explained
The temperature coefficient tells you how much output a panel loses per degree Celsius above the 25°C test cell temperature. It appears on every datasheet under "Temperature Characteristics" as a negative percentage per degree Celsius.
A typical silicon module runs around -0.30% to -0.40% per degree Celsius; premium modules publish closer to -0.25%. Thin-film products often carry a different coefficient, sometimes better on hot days but lower in overall conversion efficiency.
Why Cell Temperature Is Not Air Temperature
The 25°C rating refers to the cell, not the air. Installers commonly assume cell temperature runs roughly 25°C to 30°C above air temperature for a flush-mounted array with decent airflow, and hotter for arrays mounted tight to the roof.
So on an 85°F (about 29°C) afternoon, cell temperature on a flush roof mount can plausibly reach 55°C to 60°C. That is 30°C to 35°C above the test condition.
Run the Math on a Hot Roof
Take a panel with a -0.35% per degree Celsius coefficient and a cell temperature of 55°C:
- Degrees above test condition: 55°C - 25°C = 30°C
- Output loss: 30 × 0.35% = 10.5%
- A 400-watt panel derated: 400 × (1 - 0.105) = 358 watts
Now compare a panel with a -0.25% coefficient under the same conditions:
- Output loss: 30 × 0.25% = 7.5%
- A 400-watt panel derated: 400 × (1 - 0.075) = 370 watts
That 12-watt difference per panel compounds to roughly 240 watts across a 20-panel array on the hottest afternoons, exactly when air conditioning load peaks.
What Changes the Cell Temperature
Several installation details move cell temperature up or down:
- Mounting height and airflow: Standoff mounts and ground mounts run cooler than flush roof mounts because air moves behind the panels.
- Roof material and color: Dark shingle and membrane roofs absorb more heat and radiate it toward the array.
- Array density: Panels packed edge to edge trap heat; leaving small gaps helps.
How to Use the Coefficient When Choosing Panels
Treat the temperature coefficient as a selection input alongside efficiency and cost per watt, not a tiebreaker:
- Hot climates and dark roofs: A better coefficient can outweigh a small efficiency advantage, because the array will spend more hours at high cell temperature.
- Mild coastal climates: The coefficient matters less; efficiency and cost per watt usually dominate.
- Roof-space-constrained projects: High efficiency still wins, but check the coefficient so the summer derate does not erase the advantage.
Ask for the coefficient before you sign, and ask what cell temperature the production model assumes. A quote assuming 25°C year-round is optimistic; a realistic model shows lower summer output but a more honest annual estimate.
If you want to see how temperature derating changes a modeled system for your address, run your own numbers and compare the summer and winter production curves.
Solar Panel Efficiency vs Cost: The Trade-Off That Decides Your Payback
Higher efficiency usually costs more per watt. The question is whether the extra output justifies the premium for your roof.
Here is how we frame the decision:
| Your Situation | What Matters Most | Why |
|---|---|---|
| Small or broken-up roof | High efficiency | Fewer panels fit, so each one must work harder |
| Large open roof | Lower cost per watt | Space is not the constraint, budget is |
| Heavy afternoon shade | Temperature coefficient and layout | Shade tolerance beats raw efficiency |
| Tight budget, long horizon | Value-tier panels | Payback comes from production, not spec sheets |
The trade-off is real. A 23% panel on a cramped roof beats a cheaper 20% panel that cannot fit enough capacity. On a wide-open roof, the cheaper panel often wins on payback.
For the full payback math, work through our solar panel ROI calculation guide.
Degradation and Long-Term Efficiency
Panels lose a little output every year. A University of Kentucky case study measured an average 1.04% annual decline in generation capability from material degradation (University of Kentucky solar PV case study).
Over 25 years, that compounds. A system producing 10,000 kWh in year one may produce roughly 7,700 kWh in year 25 at that rate.
Warranties matter here. Most manufacturers guarantee a production floor over 25 years. Read that clause as carefully as the efficiency rating.
Get Your Roof Modeled Before You Compare Quotes
Datasheet efficiency numbers tell you how a panel performs in a lab, not what your roof will produce.
That gap is where quotes go wrong. Two installers can quote the same panel count and deliver very different annual output because of layout, inverter choice, and shade handling.
Before you sign anything, learn how to compare solar quotes line by line.
Frequently Asked Questions
How do you calculate solar panel efficiency?
Divide the panel's rated power output by the sunlight energy hitting its surface, then multiply by 100. A 400-watt panel measuring about 1.94 square meters, under 1,000 W/m² irradiance, produces roughly 400 ÷ 1,940 = 20.6% efficiency. Use the panel's physical dimensions and its nameplate wattage from the spec sheet. This solar panel efficiency calculation gives you a number you can compare across manufacturers, but it says nothing about how much electricity your roof will actually generate.
Do more efficient solar panels always produce more electricity?
Not necessarily. Efficiency measures power per unit of area, so a 22% panel and a 20% panel of the same wattage deliver the same solar panel output. Higher efficiency matters most when roof space is tight or shading is complex. The University of Michigan Center for Sustainable Systems notes most available panels sit near 20% efficiency, while EnergySage reports the best panels exceed 23%. If you have plenty of unshaded roof, a slightly lower-efficiency panel can produce the same kilowatt-hours for less money.
How does temperature affect solar panel efficiency in real-world conditions?
Heat reduces voltage, and the solar panel temperature coefficient tells you how much. A typical coefficient of -0.30% per degree Celsius means a panel loses about 0.3% of its rated power for every degree above 25°C (77°F) cell temperature. On a 95°F day with panels at 140°F, that is roughly a 10% output drop. The University of Kentucky case study also found generation capability declining about 1.04% per year from material degradation, separate from heat losses.
Is a higher solar panel efficiency worth the extra cost?
Only when it solves a constraint. Solar panel efficiency vs cost favors higher-efficiency modules when roof area is limited, when you want maximum production from a small array, or when installation labor is a large share of the project. On a large, unshaded roof, paying more per watt for efficiency you do not need lengthens payback. Compare quotes on total system output and installed cost per watt, not efficiency percentage alone, before deciding.
Most homeowners compare panel efficiency ratings and stop there. The better move is to model your roof, check the temperature coefficient, and confirm how your utility credits production. Go Solar DMV handles that work for you with 3D irradiance modeling, state-specific net metering tariffs, and a quote comparison audit, all built around a system installed and maintained at no cost. Get started with Go Solar DMV and see what your roof can actually produce.
